

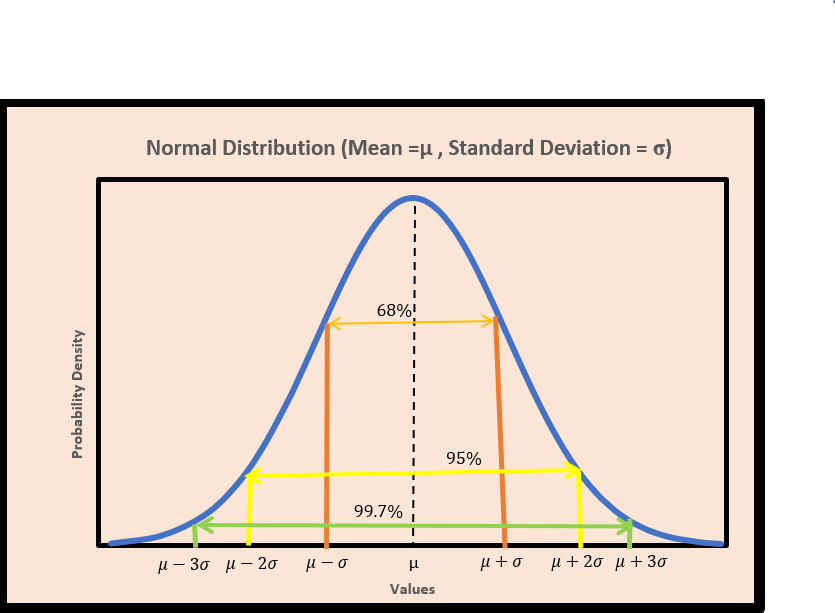
Before we proceed to the Empirical Rule, let’s have a look at the Normal Distribution. From the graph below, there are some quick observations:
The curve is bell-shaped.
The curve has the centre at the mean.
The curve is symmetrical around the mean.
Most of the data points are clustered around the mean. As the data points move away from the mean on both the sides, the probability density starts decreasing.
Well, these are some of the key properties of the Normal distribution.
Moving on, can you see some percentage values in the graph?
To know what these values represent, we need to learn about the Empirical rule.
The empirical rule tells how the data is distributed in a Normal distribution. It is also known as 68-95-99.7 rule or three-sigma rule.
It states that
Approx. 68% of the data lies within 1 standard deviation of the mean.
i.e. Approx. 68% of the data lies in the range of [mean - std_dev, mean + std_dev] .
Approx. 95% of the data lies within 2 standard deviations of the mean.
i.e. Approx. 95% of the data lies in the range of [mean -2 *std_dev, mean + 2*std_dev] .
Approx. 99.7% of the data lies within 3 standard deviations of the mean.
i.e. Approx. 99.7% of the data lies in the range of [mean - 3*std_dev, mean + 3*std_dev] .
Isn’t it intuitive?
As we keep on increasing the size of the interval, it will start containing more and more data points.
Check the Normal distribution graph again and see if the percentage values make sense now?
Let’s understand the application of empirical rule with a real life example.
Suppose, we have a dataset containing marks of 50 students and it follows a Normal distribution with mean = 50 and std_dev = 15
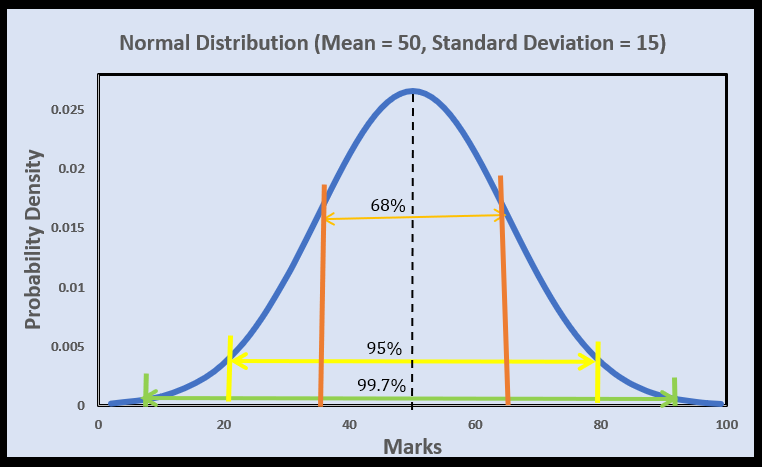
Then, as per empirical rule, we can conclude that:
Approx. 68% of the students scored in the range of [mean-stddev, mean+stddev] = [50-15, 50+15] =[35, 65]
Approx. 95% of the students scored in the range of [mean-2*stddev, mean+2*stddev] = [50-2*15, 50+2*15] =[20, 80]
Approx. 99.7% of the students scored in the range of [mean-3*stddev, mean+3*stddev] = [50-3*15, 50+3*15] =[5, 95]
Another important application of empirical rule is to identify the outliers.
As per empirical rule, most of the data points in a Normal distribution lies within 3 standard deviations of the mean. i.e. in the range of [mean-3*stddev, mean+3*stddev]. Any data point outside of this range can be a potential outlier.
Have you ever used empirical rule in your projects?
Curious about a specific AI/ML topic? Let me know in comments.
Also, please share your feedbacks and suggestions. That will help me keep going. Even a “like” on my posts will tell me that my posts are helpful to you.
See you soon!
-Kavita
P.S. Let’s grow our tribe. Know someone who is curious to dive into ML and AI? Share this newsletter with them and invite them to be a part of this exciting learning journey.